
Africa Briefs | Jobs, Economy, and Trade (JET)
Executive Summary
Over the past twenty-four years, reported intra-African trade expanded rapidly from $31.8 billion in 2000 to an all-time high of $211.6 billion in 2024, compounding at an annual rate of 8.2%. This structural expansion highlights a deepening commercial integration across regional zones, underpinned by trade facilitation initiatives and expanding regional markets. However, a granular zone-level analysis demonstrates pronounced asymmetries: Southern and Western Africa function as the continent’s primary supply engines, while Eastern Africa emerges as the dominant demand driver with unprecedented import momentum. Conversely, Central and Northern Africa remain structurally constrained by narrow export bases and infrastructure bottlenecks.
| KEY INSIGHTS • Southern Africa Dominates Continental Supply: Accounting for $37.8 billion (31.3%) of intra-African exports and $61.5 billion in total trade in 2024, Southern Africa remains the largest trading bloc, heavily anchored by South Africa ($31.1 billion in exports). • Eastern Africa Is the Primary Demand & Growth Hub: Eastern Africa expanded its total trade from $7.1 billion in 2000 to a record $51.6 billion in 2024 (8.6% CAGR), overtaking Southern Africa as the largest importing zone at $27.0 billion (29.8% continent share). • Western Africa Is Export-Heavy But Below Historic Peak: Western Africa generated $34.3 billion in exports in 2024, driven by Nigeria’s $15.7 billion, yet remains below its 2011 high of $47.1 billion, illustrating lingering vulnerability to commodity cycles. • Central Africa Faces Persistent Integration Lags: Representing the smallest trading zone at just 8.0% ($17.0 billion) of intra-African trade, Central Africa’s market share has steadily slipped from 9.4% in 2000, signaling structural transit barriers. • Trade Hub Friction: Three regional trade bloc (Southern, Western and Northern, sustains positive trade balance in 2024, reported exports ($121.0 billion) exceeded reported imports ($90.6 billion) by $30.4 billion in 2024, reflecting re-export dynamics, valuation differences, and informal cross-border trade flows. |
Intra-African Exports: Supply Concentration & Growth Trajectories
Total reported intra-African exports expanded from $15.7 billion in 2000 to $121.0 billion in 2024, achieving a compound annual growth rate (CAGR) of 8.9%. Growth occurred in distinct phases: a robust expansion through 2011 ($114.8 billion), followed by a prolonged stagnation during the global commodity downturn and pandemic-induced lockdowns ($76.8 billion in 2020), before staging a strong post-2020 recovery. The post-2020 rebound was led by Western Africa (13.6% annual growth) and Northern Africa (13.5% annual growth).
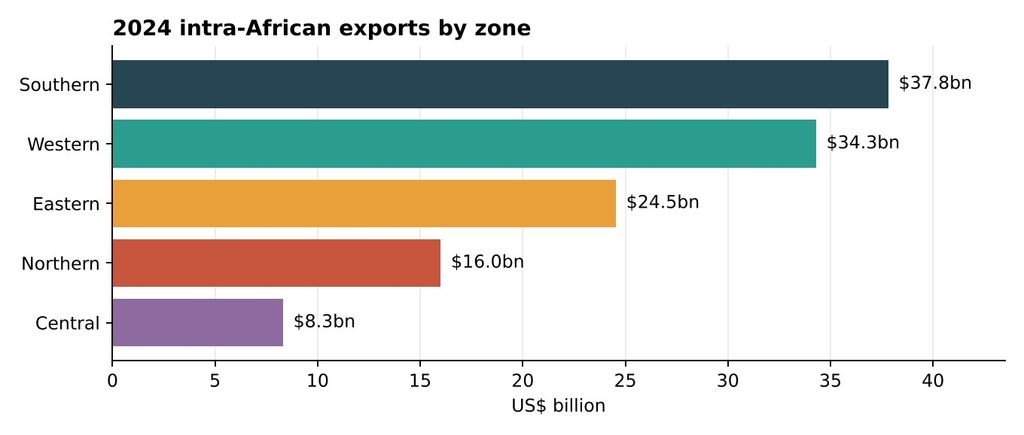
Figure 1: Intra-African exports in 2024, ranked by zone, Source: Afreximbank
Despite continental growth, supply capacity remains highly concentrated. Southern Africa leads exports at $37.8 billion (31.3% of 2024 continental total), followed closely by Western Africa at $34.3 billion (28.4%). Together, these two zones control nearly 60% of intra-continental supply. Export concentration within zones is equally pronounced: South Africa supplies 82% ($31.1 billion) of Southern Africa’s exports, Nigeria supplies 46% ($15.7 billion) of Western Africa’s exports, and Egypt supplies 48% ($7.6 billion) of Northern Africa’s exports. In contrast, Eastern Africa exhibits a far more balanced export profile, led by Kenya ($4.1 billion), Tanzania ($4.0 billion), and Zambia ($3.5 billion).
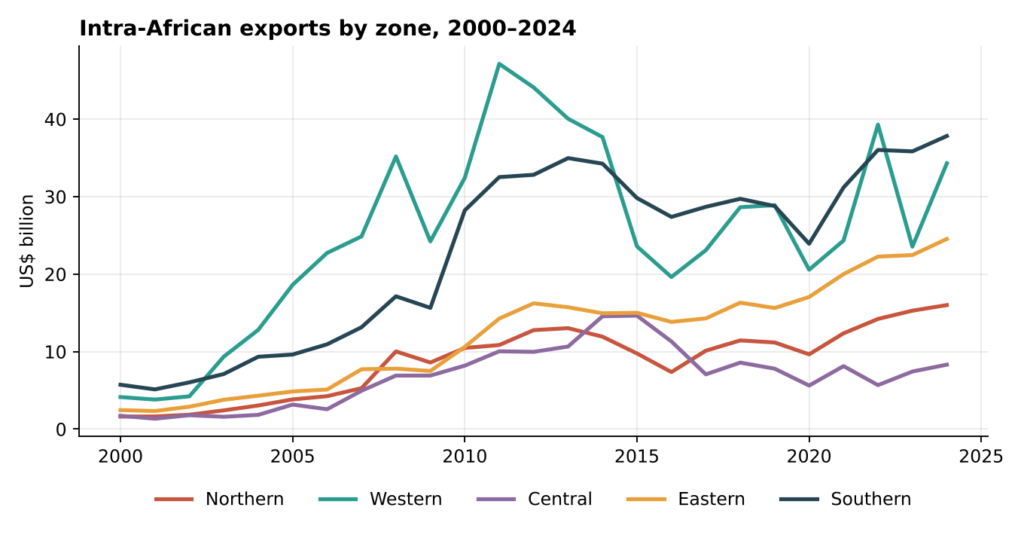
Figure 2: Intra-African exports, annual values by zone, 2000–2024 (US$ billion). Source: Afreximbank
Intra-African Imports: Re-balancing Demand Across Regional Blocs
Reported intra-African imports grew from $16.1 billion in 2000 to $90.6 billion in 2024, compounding at 7.5% annually. Crucially, import demand has structurally shifted toward Eastern and Western Africa over the twenty-four-year horizon. Eastern Africa has emerged as the continent’s dominant demand hub, expanding imports from $4.6 billion in 2000 to a record $27.0 billion in 2024 (29.8% of continental imports). In doing so, Eastern Africa officially surpassed Southern Africa ($23.6 billion), whose imports peaked at $29.0 billion in 2014 and have since flattened.
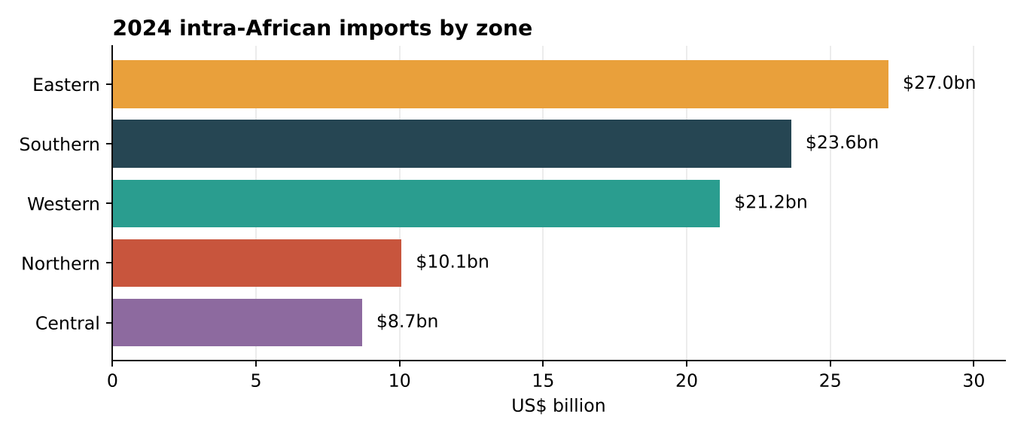
Figure 3: Intra-African imports in 2024, ranked by zone, Source: Afreximbank
Western Africa experienced substantial import expansion, rising to $21.2 billion in 2024. This growth was anchored by Mali, whose intra-African imports scaled from $0.7 billion in 2000 to $6.6 billion in 2024, now representing nearly a third of Western Africa’s import volume, followed by Côte d’Ivoire ($4.1 billion) and Burkina Faso ($2.2 billion). Northern Africa’s import trajectory reflects significant historical volatility, peaking at $18.0 billion in 2018 due to isolated reporting surges in Algeria ($10.1 billion in 2018), before stabilizing at $10.1 billion in 2024.
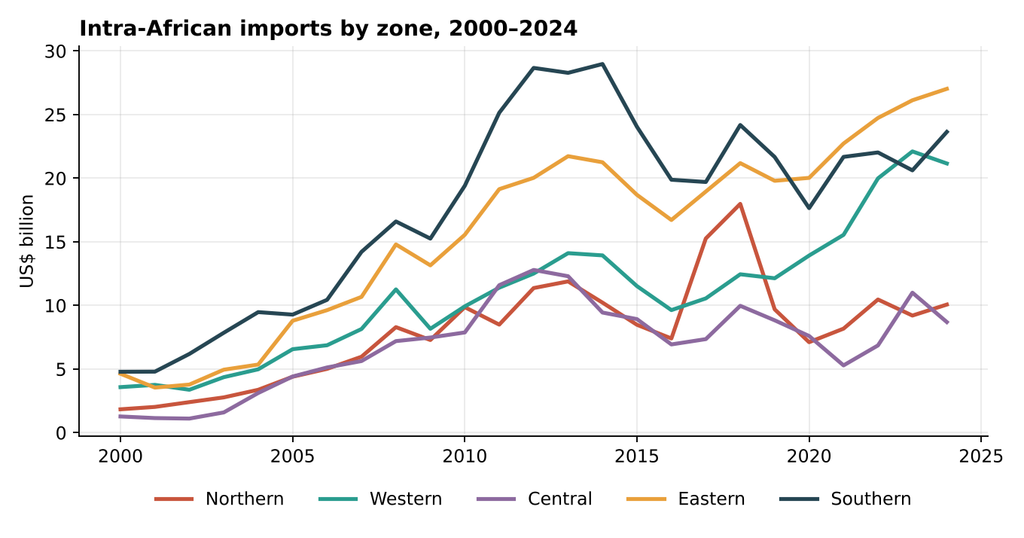
Figure 4: Intra-African imports, annual values by zone, 2000–2024 (US$ billion), Source: Afreximbank
Total Commercial Exchange: Zone Rankings and Market Momentum
Combined two-way trade (exports plus imports) reached $211.6 billion in 2024, up from $31.8 billion in 2000 (8.2% CAGR). The top three zones, Southern ($61.5 billion), Western ($55.5 billion), and Eastern ($51.6 billion), account for 79.6% of total intra-African commercial activity. While long-term zonal growth rates cluster tightly between 7.5% and 8.8%, market shares have shifted meaningfully.
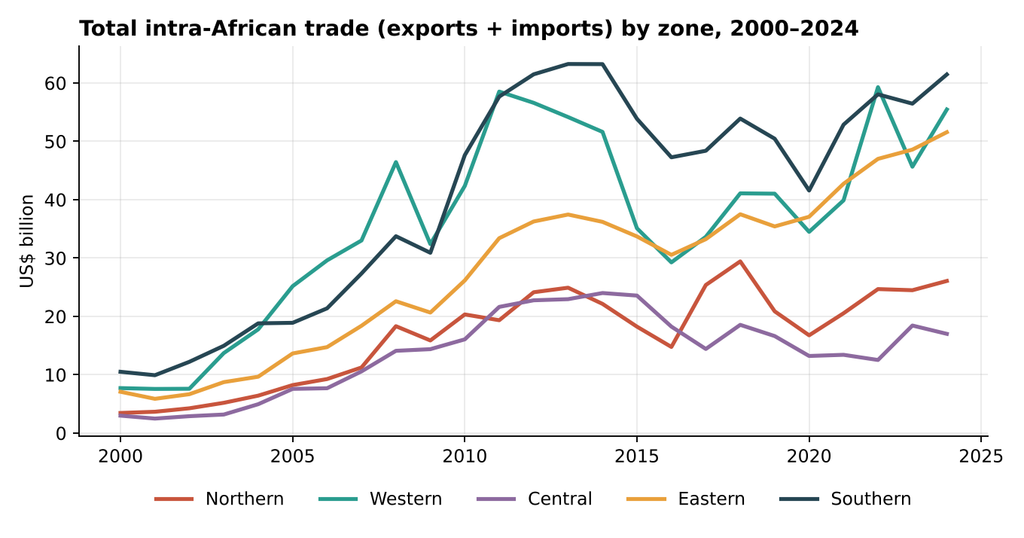
Figure 5: Total intra-African trade, annual values by zone, 2000–2024 (US$ billion), Source: Afreximbank
Southern Africa’s share of total trade contracted from 33.1% in 2000 to 29.1% in 2024, whereas Eastern Africa increased its share from 22.3% to 24.4%, steadily closing the gap on Western and Southern Africa.
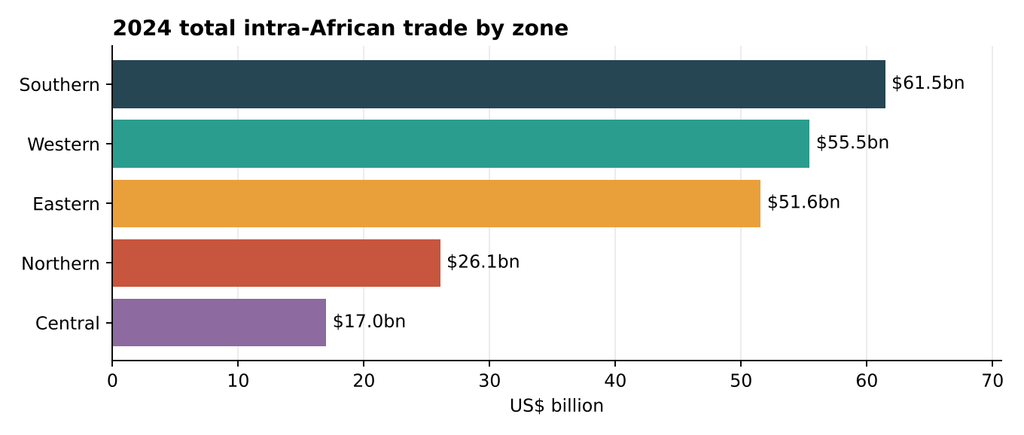
Figure 6: Total intra-African trade in 2024, ranked by zone, Source: Afreximbank
Trade Balances & Hub Asymmetries: Net Suppliers vs. Net Buyers
An analysis of zonal net trade positions reveals structural division between net supplying blocs and net buying blocs. Southern Africa (+$14.2 billion), Western Africa (+$13.1 billion), and Northern Africa (+$5.9 billion) maintain large reported trade surpluses, serving as primary regional producers of manufactured goods, refined petroleum, and agricultural inputs. Conversely, Eastern Africa operates as a net importing zone (-$2.5 billion), though its deficit has narrowed from -$4.9 billion in 2010 as regional production scaled.
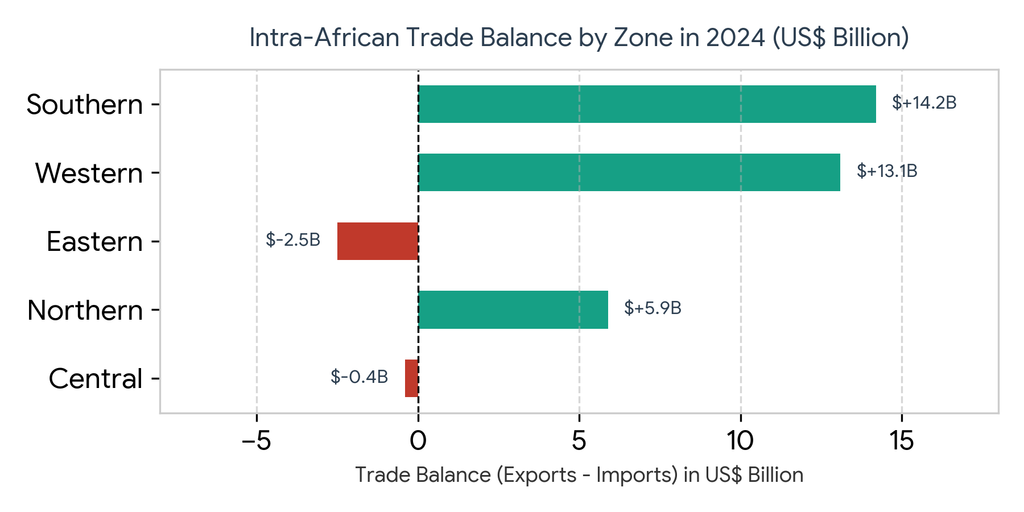
Figure 7: Reported Intra-African Trade Balance by Zone in 2024 (US$ Billion), Source: Afreximbank
Across the continent, reported exports ($121.0 billion) exceeded reported imports ($90.6 billion) by $30.4 billion in 2024. This persistent reporting gap underscores the role of intermediate distribution hubs (such as South Africa, Ivory Coast, and Kenya) and highlights cross-border logistics friction where re-exported goods are recorded at full export value but face inconsistent import clearance tracking.
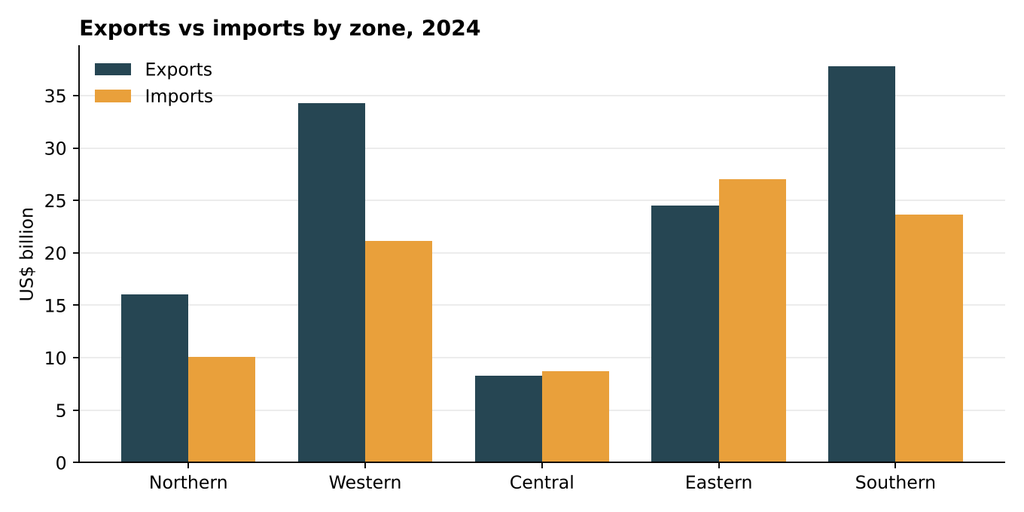
Figure 8: Exports and imports by zone, 2024 (US$ billion), Source: Afreximbank
Leading countries in each zone, 2024
| Zone | Top 3 exporters | Top 3 importers |
| Northern Africa | Egypt ($7.6bn), Morocco ($3.1bn), Algeria ($2.7bn) | Tunisia ($2.6bn), Morocco ($2.5bn), Algeria ($2.1bn) |
| Western Africa | Nigeria ($15.7bn), Ghana ($5.0bn), Ivory Coast ($4.5bn) | Mali ($6.6bn), Ivory Coast ($4.1bn), Burkina Faso ($2.2bn) |
| Central Africa | DR Congo ($3.4bn), Angola ($2.8bn), Gabon ($1.1bn) | DR Congo ($4.4bn), Republic of the Congo ($1.6bn), Cameroon ($0.9bn) |
| Eastern Africa | Kenya ($4.1bn), Tanzania ($4.0bn), Zambia ($3.5bn) | Zimbabwe ($5.3bn), Zambia ($4.4bn), Uganda ($4.1bn) |
| Southern Africa | South Africa ($31.1bn), Namibia ($3.3bn), Eswatini ($2.2bn) | South Africa ($11.0bn), Botswana ($5.6bn), Namibia ($3.9bn) |
Table 1: Largest three exporters and importers in each zone, 2024
Single-country dependence is highest in Southern Africa (South Africa), Western Africa (Nigeria on exports, Mali on imports) and Northern Africa (Egypt on exports). Eastern and Central Africa are more evenly spread, which can make their totals less sensitive to one market.
Socioeconomic Impact: Households, Businesses, and Governments
1. Impact on Households: Expanding intra-regional imports, particularly in Eastern and Western Africa, improves household food security and consumer choice by facilitating trade in staple foodstuffs, processed agricultural products, and light manufactures. However, high zonal export concentration leaves consumers vulnerable to regional price shocks when dominant suppliers face macroeconomic disruption.
2. Impact on Businesses: For micro, small, and medium enterprises (MSMEs), growing buyer momentum in Eastern Africa creates expanding export destinations. Conversely, industrial manufacturers in South Africa, Nigeria, and Egypt benefit from dominant supply positions. Unlocking cross-border value chains under AfCFTA will allow businesses to source raw materials from neighboring zones at reduced tariff rates, mitigating reliance on volatile extra-African imports.
3. Impact on Governments: For policymakers, trade expansion drives customs revenue and foreign exchange stabilization. However, persistent trade deficits in net-importing zones (Eastern and Central trade bloc), exert pressure on national currency reserves. Governments must prioritize border infrastructure, harmonize customs procedures, and utilize regional payment systems like PAPSS to lower transaction costs and capture informal cross-border trade within formal tax structures.